Getting Started
Setup
Follow the installation instructions from the README.md file
git clone https://github.com/mellow-finance/mellow-strategy-sdk.git
cd mellow-strategy-sdk
python3 -m venv .venv
source .venv/bin/activate
pip install poetry==1.1.13
poetry install
The easiest way to get started is to clone SDK and use examples in the Github repo.
The notebook with this code is also in the examples.
Choose pool
A typical notebook would start with downloading and preparing data for a specific pool.
POOLS is a list of available pools, let’s choose 1 it is WBTC/WETH, fee 0.3%
from strategy.primitives import POOLS, Pool
pool_num = 1
my_pool = Pool(
    tokenA=POOLS[pool_num]['token0'],
    tokenB=POOLS[pool_num]['token1'],
    fee=POOLS[pool_num]['fee']
)
Get data
For each pool at the first run you need to download the data
from strategy.data import DownloaderRawDataUniV3
# downloads mint, burn, swap for the pool, this needs to be done once the files are added to ../data/
# ~5min
DownloaderRawDataUniV3().load_events(pool_num)
You also you can use strategy.data.SyntheticData or utilities.utilities.get_data_from_binance
After loading the data, they can be read locally. Сreate an object with pool data.
from strategy.data import RawDataUniV3
data = RawDataUniV3(my_pool).load_from_folder()
Create strategy
from strategy.strategies import AbstractStrategy
from strategy.uniswap_utils import UniswapLiquidityAligner
from strategy.positions import UniV3Position

class UniV3Passive(AbstractStrategy):
    """
    ``UniV3Passive`` is the passive strategy on UniswapV3 without rebalances.
        i.e. mint interval and wait.
        lower_price: Lower bound of the interval
        upper_price: Upper bound of the interval
        rebalance_cost: Rebalancing cost, expressed in currency
        pool: UniswapV3 Pool instance
        name: Unique name for the instance
    """
    def __init__(self,
                lower_price: float,
                upper_price: float,
                pool: Pool,
                rebalance_cost: float,
                name: str = None,
                ):
        super().__init__(name)
        self.lower_price = lower_price
        self.upper_price = upper_price
        self.decimal_diff = -pool.decimals_diff
        self.fee_percent = pool.fee.percent
        self.rebalance_cost = rebalance_cost

    def rebalance(self, *args, **kwargs) -> str:
        timestamp = kwargs['timestamp']
        row = kwargs['row']
        portfolio = kwargs['portfolio']
        price_before, price = row['price_before'], row['price']


        if len(portfolio.positions) == 0:
            univ3_pos = self.create_uni_position(price)
            portfolio.append(univ3_pos)
            return 'mint'

        uni_pos = portfolio.get_position('UniV3Passive')
        uni_pos.charge_fees(price_before, price)


    def create_uni_position(self, price):
        univ3_pos = UniV3Position('UniV3Passive', self.lower_price, self.upper_price, self.fee_percent, self.rebalance_cost)
        x_uni_aligned, y_uni_aligned = univ3_pos.swap_to_optimal(x=1 / price, y=1, price=price)
        univ3_pos.deposit(x=x_uni_aligned, y=y_uni_aligned, price=price)
        return univ3_pos
Typycally the definition of the rebalance method would contain two sections:
- Init
On the first call you need to initialize strategy’s portfolio under management. Here you need to create initial positions with
appendmethod ofstrategies.portfolio.Portfolio()and invest initial amount usingdepositmethod.
- Rebalance
In this section you decide if you want to rebalance or not. If you rebalance you need to implement the logic of rebalance.
Backtest
Next step is to run backtest using your strategy and data:
from strategy.backtest import Backtest

univ3_passive = UniV3Passive(
    lower_price=data.swaps['price'].min(),
    upper_price=data.swaps['price'].max(),
    pool=pool,
    rebalance_cost=0.,
    name='passive'
)
b = Backtest(univ3_passive)
portfolio_history, rebalance_history, uni_history = b.backtest(data.swaps)
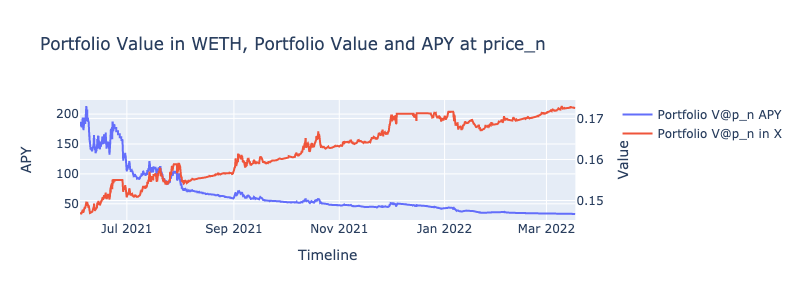
Visualize
Next visualize results
from strategy.viewers import RebalanceViewer, UniswapViewer, PotrfolioViewer
import plotly.offline as pyo
import plotly.graph_objs as go
rv = RebalanceViewer(rebalance_history)
uv = UniswapViewer(uni_history)
pv = PotrfolioViewer(portfolio_history, pool)
# Draw portfolio stats, like value, fees earned, apy
fig1, fig2, fig3, fig4, fig5, fig6 = pv.draw_portfolio()
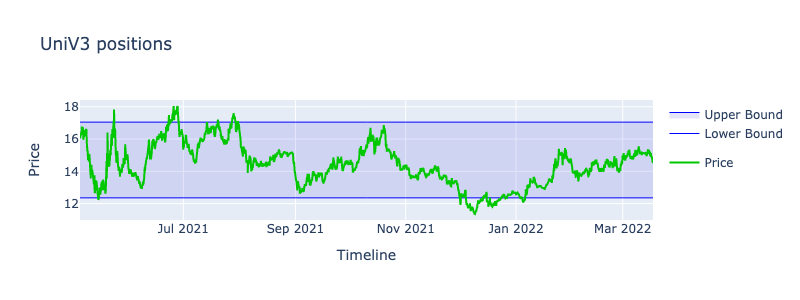
# Draw Uniswap intervals
intervals_plot = uv.draw_intervals(data.swaps)
# Draw rebalances
rebalances_plot = rv.draw_rebalances(data.swaps)
# Calculate df with portfolio stats
stats = portfolio_history.calculate_stats()
intervals_plot.update_layout(height=300, width=800).write_image("intervals_plot.png")
rebalances_plot.update_layout(height=300, width=800).show()
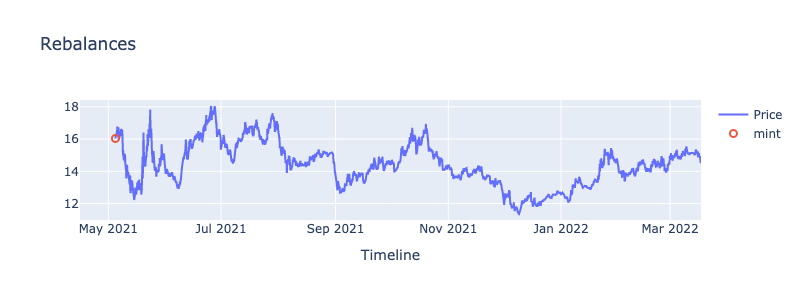
fig2.update_layout(height=300, width=800).show()
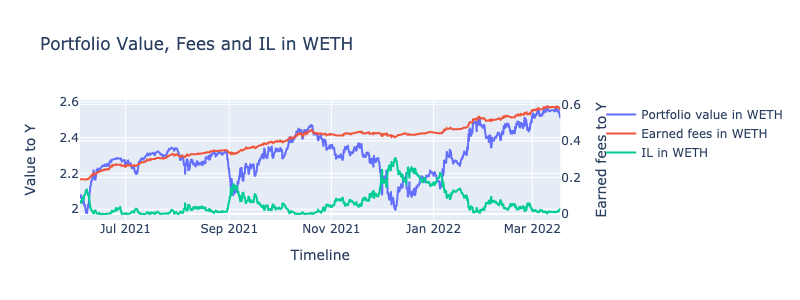
fig4.update_layout(height=300, width=800).show()
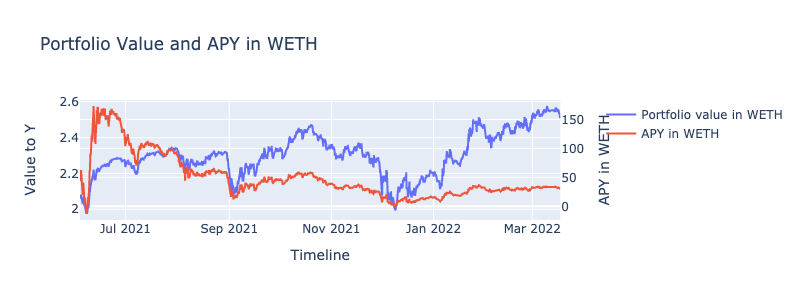
fig6.update_layout(height=300, width=800).show()
stats.tail(3)
timestamp |
price |
total_value_x |
total_value_y |
total_il_x |
total_il_y |
total_fees_x |
total_fees_y |
total_value_to_x |
total_value_to_y |
total_fees_to_x |
total_fees_to_y |
total_il_to_x |
total_il_to_y |
hold_to_x |
hold_to_y |
vpn_value |
vpn_hold |
portfolio_apy_x |
portfolio_apy_y |
hold_apy_x |
hold_apy_y |
vpn_apy |
|---|---|---|---|---|---|---|---|---|---|---|---|---|---|---|---|---|---|---|---|---|---|---|
2022-03-17T17:12:32.024000000 |
14.580860285519847 |
0.08438109390436045 |
1.283817410373051 |
-0.039848089756931424 |
0.6093134770111877 |
0.019824508912898182 |
0.2893447834426407 |
0.17242921899667762 |
2.5141663513318613 |
0.039668659242627836 |
0.578403178130652 |
0.0019404923349148756 |
0.028294047620516016 |
0.13470105208896468 |
1.9640572208217253 |
0.1725279260223562 |
0.13482436008811285 |
45.3704504013658 |
30.24819845834532 |
9.296761797586672 |
-2.0729021464680364 |
32.952626752710316 |
2022-03-17T17:50:59.008000000 |
14.566802837652778 |
0.0847962980188726 |
1.27778439529345 |
-0.040262051984760086 |
0.6153464920907888 |
0.019825750799581668 |
0.2893447834426407 |
0.17251523054884332 |
2.5129953498972144 |
0.039689051392538977 |
0.5781425864485839 |
0.0019810193980844618 |
0.028857118989461972 |
0.1348071985543888 |
1.963709882438092 |
0.17252890365645912 |
0.13482436008811285 |
45.454211937843915 |
30.1781295681117 |
9.396250588567012 |
-2.0929054328821084 |
32.95349695422687 |
2022-03-17T18:06:55.268000000 |
14.564532604580709 |
0.08486340853404364 |
1.2768098095889577 |
-0.040328961770573685 |
0.6163210777952812 |
0.01982595152893911 |
0.2893447834426407 |
0.17252909917126924 |
2.5128056901188893 |
0.03969234829553624 |
0.5781005009027111 |
0.001987609212379886 |
0.028948599178871826 |
0.13482436008811285 |
1.9636537883950496 |
0.17252909917126924 |
0.13482436008811285 |
45.467718370952916 |
30.166781424547274 |
9.41233686472187 |
-2.0961358484948067 |
32.953670983931296 |
Congratulations! Now you have the results of your strategy backtest on the real UniV3 data!